
Session 1 — Foundations

Decision-Grade for Practitioners 1 — Foundations

Your Organisation × Industrial Linguistics

Session 1 of 3 140-minute facilitated session Last updated: 2026-07-05

Course content

  • Course materials, templates and reference cards are available from the Decision-Grade site: https://decision-grade.industrial-linguistics.com
  • Use the downloadable artefacts during the exercises rather than recreating them from screenshots.
  • Key artefacts: Data Artefact Passport, Decision-Ready Brief, Dashboard Trust Cue Checklist and CHORDS reference card.

Session 1 Roadmap

Definitions, data quality, spreadsheets, and decision-ready briefs.

Warm-Up
Definitions
Spreadsheets
Data Quality
Decision-Ready Briefs
Summary

About me

Greg Baker

Greg Baker

Data Science lecturer at Macquarie University / Consulting CTO

  • Ex-CTO of Daisee and Pixc; 2 technology business exits.
  • Author of 8 books, 1 patent, 3 film scores, and many scientific papers.
  • Researches mathematical approaches to make AI explainable and governable.
  • Ex-Googler and ex-CSIRO, with affiliations at ANU and Macquarie University.
  • Clients include ACT Treasury, AAT, Allianz, Atlassian, Aon, Auckland City Council, Australian Parliament, Fujitsu, Hewlett-Packard, Vodafone, and Woolworths.

Use real spreadsheets, dashboards, reports, and evidence trails as the test cases.

Our Learning Goals

By the end of Session 1, you should be more confident doing four things:

Explain

Core data concepts and everyday artefacts in plain English: dashboards, spreadsheets, extracts, reports, and recurring requests.

Define

Usable metrics with calculation, inclusions, exclusions, freshness, owner, and known limits.

Recognise

Spreadsheet and transformation risk, especially where artefacts are reused, forwarded, or likely to become AI context.

Judge

Whether data is fit for a decision using freshness, completeness, consistency, validity, and fitness for use.

Why This Matters More With AI

  • AI tools amplify whatever you feed them — including the messy bits.
  • Models cannot see context that is not written down — owner, source, as-at date, caveats, and audience.
  • Inconsistent definitions become inconsistent answers — an AI assistant may choose one definition, blend them, or answer without exposing the mismatch.
  • Ungoverned spreadsheets become AI context — stale tabs, manual overrides, and "final_v3" files may be pasted into prompts, retrieved by assistants, or treated as evidence.
  • Transformations you do not log cannot be reviewed — a model can summarise the number, not reconstruct the steps.
  • Quality thresholds still matter — AI lowers the cost of producing an answer, not the cost of acting on a wrong one.

What the words mean, and why we need shared ones.

  • Decision-Grade Foundations
  • Welcome & Warm-Up
  • Definitions That Hold Up
  • Spreadsheets
  • then Data Quality
  • Data, Information, Decisions
  • Decision-Ready Briefs
  • Summary & Takeaways

Most operational data problems begin as workflow or definition problems.

  • At human speed, people compensate for weak systems with memory, context, and tribal knowledge.AI removes the need for human friction — so definitions, workflows, and ownership suddenly matter much more.

AI context

Before a dashboard, spreadsheet, report, extract, or briefing note can safely become AI context, it needs enough data discipline that a human can understand it without guessing.

If the business knowledge is only in someone's head, it will not travel with the artefact.

DEFINITIONS

  • Data, Information, and Decisions. Three different things — they are different, but they are all just input context to AI.
    • Data — weekly the core operational system status-report entries, site incident and service disruption records, priority, resolution notes, planned maintenance, and dashboard values for site availability, channel capacity, service level, utilisation, and power status.
    • Information — "Two high-risk the core operational system sites in the service area are operating with power or connectivity augmentation; one deployable resources Asset is activated; one planned service disruption should be deferred."
    • Decision — stage or activate an additional deployable resources Asset, deploy backup power or deployable resources, or apply a planned-service disruption embargo for the affected response period.
  • A status-report entry is data. A dashboard tile is information. Neither is a decision.

DATA, INFORMATION, DECISIONS, AND DEFINITIONS

  • What Counts as Data Here?
    • core operational network (the core operational system) dashboard
    • Weekly status reports and monthly performance reports
    • the field status feed field status tool (JIMS)
    • Asset deployment logs
    • the major capital program trackers
    • Briefing notes and recurring requests for "the numbers"
  • All of these shape shared decisions — so all of them need common shared standards.

DATA, INFORMATION, DECISIONS, AND DEFINITIONS

  • What a Useful Metric Definition Must Include. A metric is only useful if everyone reading it (including AI) can answer:
    • Calculation — the exact formula or logic
    • Inclusions — what's counted
    • Exclusions — what's deliberately left out
    • Owner — who maintains it
    • Frequency / freshness — how often it updates
    • Known limitations — what it can't tell you
DEFINITIONS

  • Worked Example: A Metric Definition That Holds Up
  • Metric: the core operational system Site Availability — the priority service area
  • Calculation: % of time selected the core operational system fixed sites and deployed deployable resources were operational during the reporting window, cut by location and asset type.
  • Inclusions: fixed the core operational system sites; deployed deployable resources; temporary and backup-powered sites; locations within the priority service area.
  • Exclusions: third-party provider disruptions (tracked separately via the field status feed); unrelated services; non-the core operational system services.
  • Owner: your organisation operations (the field status feed); operational reporting via the delivery partner. Exact internal owner to be confirmed.
  • Freshness: as-at operational update during an event; cadenced weekly and monthly status reports; the core operational system dashboard for partner organisations.
  • Known limits: average availability hides local site, capacity, power, and service-level issues; deployable resources must be explicitly included or excluded.

Metric Definition Duel

  • Pin down one metric so two teams (or a human and an AI) compute the same number.
  • Pick one metric from your work — "active site", "deployed system", "customer", "open ticket", etc. or use one of the pre-supplied ones
  • Write the definition in a few sentences: what counts, what doesn't, and the as-at moment. Make sure you include the following words. Rule, Inclusions, Exclusions, Owner, Freshness
  • Ask the AI — it will ask pedantic and annoying questions about your definition and consider weird corner cases
  • Rewrite if it broke — adjust the sentence until the AI bot is no longer able to find confusing cases .
  • Output: a metric definition you'd be comfortable handing to a colleague or an AI prompt.
  • Definitions
  • https://decision-grade.industrial-linguistics.com/duel/

Last updated: 2026

Spreadsheets

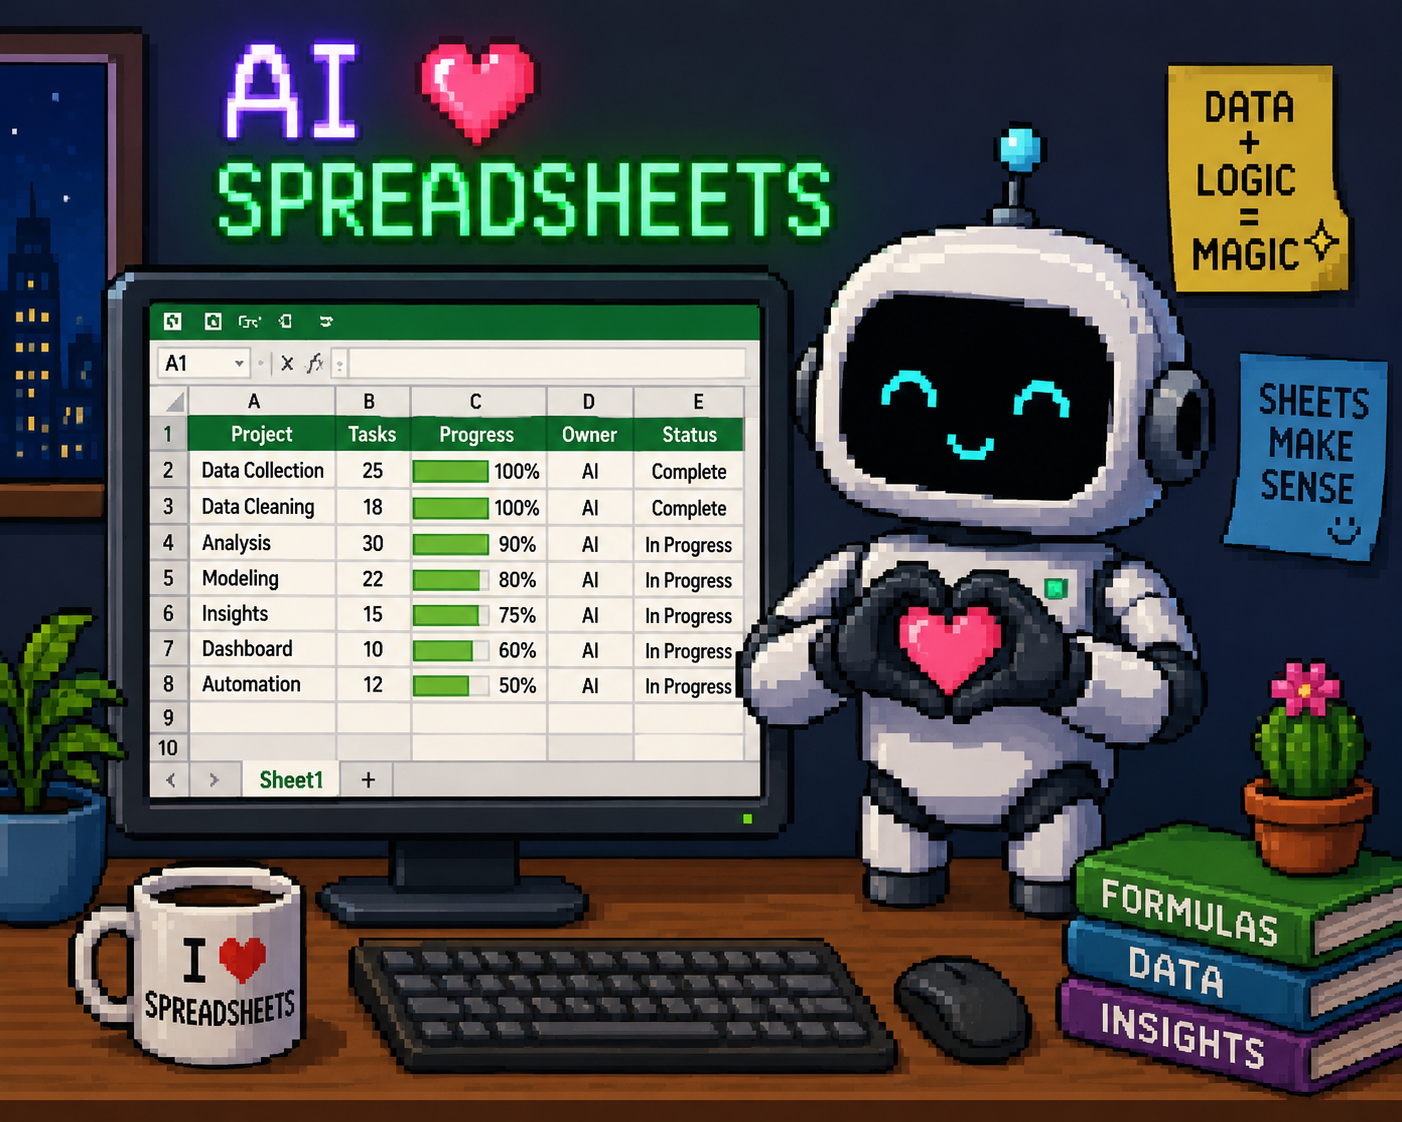
AI bots love spreadsheets

  • Usually named something that is clear and promising
    • Searching Sharepoint finds it quickly
  • Copilot has Excel tools; bots that can run Python usually have access to a library (pandas) that lets them read spreadsheets by treating them as a database
  • Spreadsheets don’t take up much of the context window compared to other document formats
    • Tool use outputs vs injecting a document
    • The headers on each tab get read (usually)
Where Spreadsheets Fit — and Where They Become a Risk

When spreadsheets are fine

  • Ad-hoc exploration, one-off analysis, personal working files.
  • Small, low-stakes, short-lived datasets.

When they turn into shadow systems of record

  • Same file is reused for recurring reports or decisions.
  • Logic, overrides, or adjustments live only in the sheet.

Warning signs

  • Multiple versions in circulation; manual merges between files.
  • Hidden logic in cells or macros; uncontrolled extracts from source systems.
SPREADSHEETS

  • Spreadsheet Risk Spectrum. Risk rises with reuse, audience, and dependence on the file for decisions.
    • Low risk — working file: one person, single use, throwaway. E.g. scratchpad for a call.
    • Medium risk — shared working file: small team, reused weekly, still internal. E.g. team tracker with a few manual joins.
    • High risk — quasi-report: emailed to leaders, hidden formulas, owner unclear. Decisions are starting to lean on it.
    • Unsafe — shadow system: recurring decision use, multiple versions, no owner, no audit. The org runs on it; nobody governs it.
  • Signals that shift a file right: reuse, hidden logic, growing audience, recurring decision use.

Why does AI magnify that?

  • Low risk — working file: won't even be found by the document store search, unless you deliberately load it as a file for input, it won’t get used
  • Medium risk — shared working file: if it has last week's version in conversation history, it will still be roughly right (usually)
  • High risk — quasi-report: lots of copies in important places, that version from last year must be very important
  • Unsafe — shadow system: "I apologise, I shouldn't have deleted that file. You were right to call me out on that."

SPREADSHEETS

  • Same Program, Different Cost Boundary. Two spreadsheets, same the major capital program program, different answers.
    • View A: tracks your organisation the major capital program delivery costs only — build, commissioning, and your organisation-managed overheads.
    • View B: includes a partner organisation migration, decommissioning of legacy assets, and consequential costs borne by agencies.
  • Both can be technically defensible — they answer different questions, and neither file labels its scope boundary on the front page.
  • A spreadsheet can be technically accurate and still be decision-dangerous when the scope boundary, owner, or inclusion rules are unclear. If humans don’t realise the difference, how will an AI know?

SPREADSHEETS

  • Spreadsheet Risk Checklist. Run through this before you email a spreadsheet that will drive a decision.
    • Is this file reused, or single-use?
    • Does a decision depend on it? By whom, how often?
    • Is the calculation logic visible, or buried in formulas?
    • How many versions exist? Which is the source of truth?
    • Is there a named owner? A refresh schedule?
    • Could a new person run it next week without tribal knowledge?
    • Would you still trust it if three people touched it between refreshes?

Spreadsheet Shadow-System

  • Pick one of the spreadsheets you use or rely on. Decide where it needs to go next.
  • Name the sheet — what decision or report does it feed? Who else uses it?
  • Show it cold — show it to your pair partner and explain nothing. What do they think it is about?
  • AI risk — if AI were to read that spreadsheet with no other context about Your Organisation or what you do, what is the most mistaken view it could make of it?
  • Pick its next step — keep as-is, add information, or replace it with something else?
  • Justify it in one sentence — what makes that the right level of rigour for the decisions it drives?
  • Name the next owner or action — who you'll talk to back at work, and by when.
  • If you don't have a spreadsheet to hand, randomly pick one from Sharepoint or from your email.
  • Spreadsheets

Last updated: 2026

Reading spreadsheets

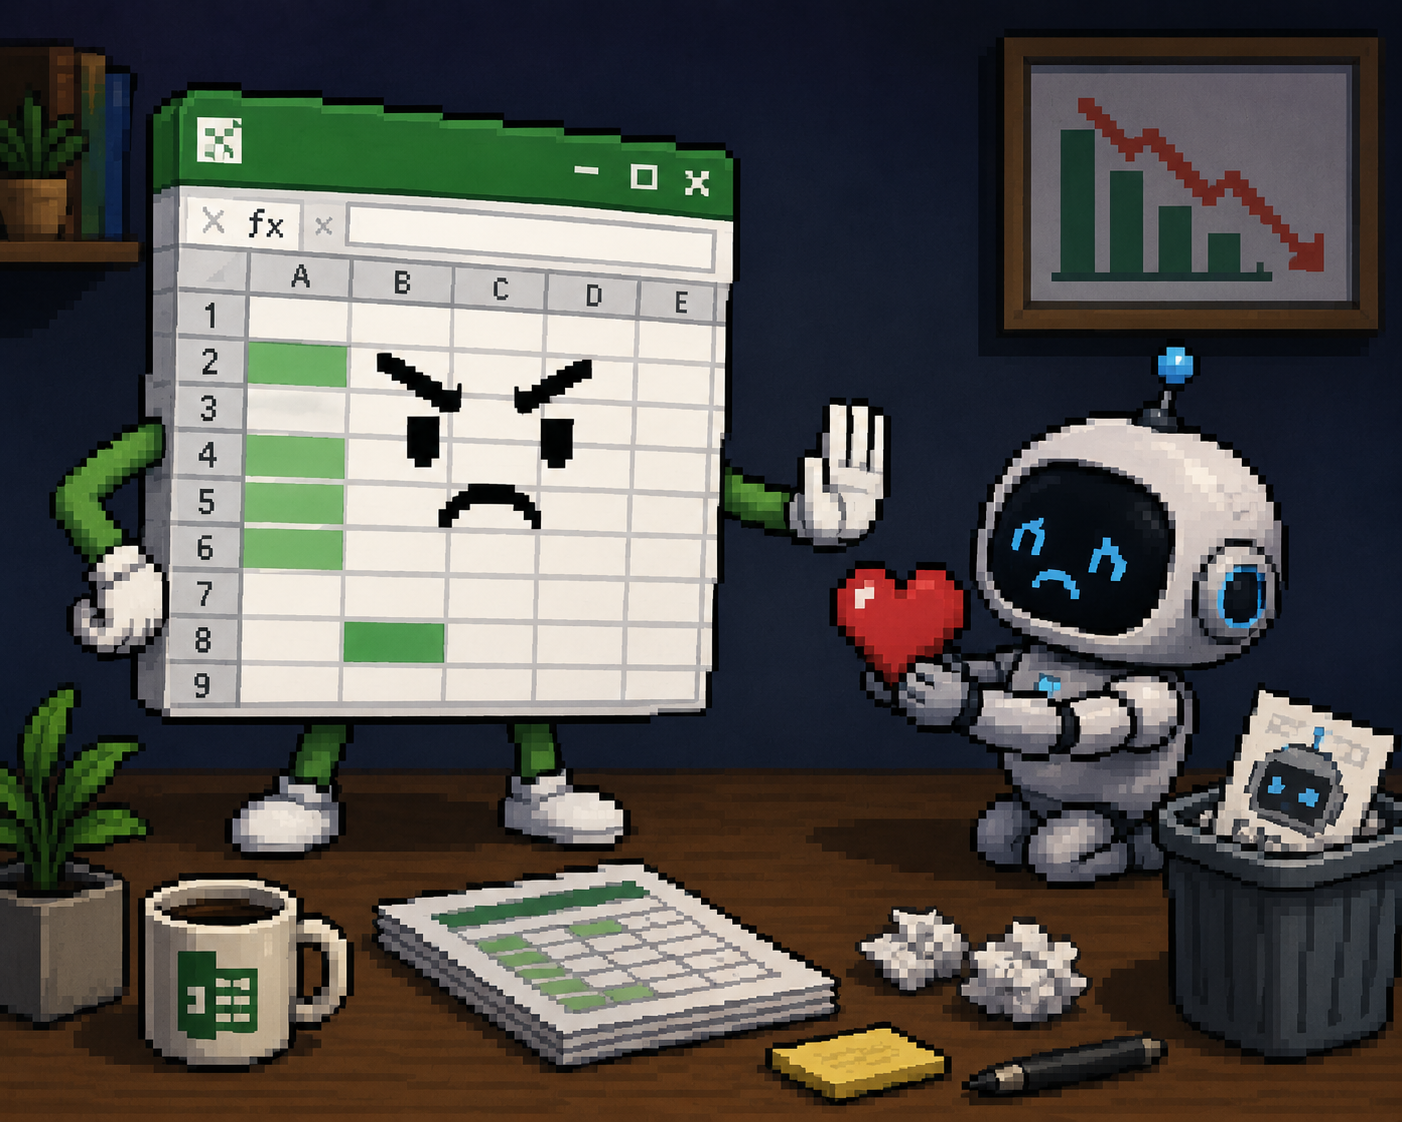
Spreadsheets don’t always love AI back

  • Easy for AI to understand
    • Tables with headers, one record per row, consistent data types (all dates in one column, all integers…)
    • SUM, MIN, MAX, IF
    • Data dictionary that says what the columns mean
    • Pivot tables
  • Hard for AI to understand
    • What rows you removed
    • Merged cells
    • Colour and fonts
    • Layout conventions: top-left area is assumptions; middle area is calculations; bottom area is outputs
    • Blank spacer rows
  • AI is good at reading spreadsheets when the spreadsheet is already behaving like data. It is much less reliable when the spreadsheet is behaving like a picture, a notebook, a dashboard, or an application.
Not all spreadsheets are equal — for humans or AI

Spreadsheet typeHuman useAI difficulty
Clean data extractAnalyse, filter, summariseEasy
Simple project trackerTrack status, owners, datesUsually easy
Risk registerTrack risks, ratings, actionsModerate; definitions matter
Executive reportPresent selected numbersModerate to hard; layout and caveats matter
Dashboard exportShare a dashboard snapshotModerate; refresh and filters matter
Financial modelForecast scenariosHard; formulas and assumptions matter
Operational workbookRun a processHard; workflow context matters
Spreadsheet “app”Tool with inputs, rules, outputsVery hard
Messy shared team sheetAd hoc collaborationVery hard
Old spreadsheet with hidden tabs/macrosInstitutional archaeologyVery hard

Spreadsheet Danger Level

  • Score a spreadsheet you already use. Decide what context would make it safer.
  • Score it — open the spreadsheet risk scoring artefact at https://decision-grade.industrial-linguistics.com and run it against the spreadsheet you had open earlier. What's the score?
  • Sense-check the score — if it's high, is that because the sheet is also hard for humans to understand?
  • Add context — what could you write alongside the file to make it safer for humans and AI to use?
    • "Rows 2–140 are raw incidents; rows 141–150 are summary totals, so exclude them from incident counts."
    • "Red cells mean manually escalated, not necessarily overdue."
    • "The pivot is filtered to May only and was refreshed yesterday."
    • "Treat Acme, ACME Pty Ltd, Acme Corp as the same supplier unless checking exact records."
    • "Sensitive — do not paste personal details into a public AI tool."
  • Spreadsheets

Last updated: 2026

Transforming data repeatably

Who Owns What? Owner, Custodian, Steward, Author, Approver

1

Owner

Ultimate authority for the data or artefact; accountable for major use and reuse decisions.

2

Custodian

Makes final decisions about classification, access approval, and access requirements.

3

Data Steward / SME

SME for definitions, KPI logic, and data-quality expectations; recommends but does not approve access.

4

Author

Produces the artefact or runs the workflow that generates it.

5

Approver

Signs off that it can be shared or published at the stated marking.

Access decision path: steward recommends or helps draft -> custodian approves -> steward or administrator may execute the change. AI tools sit downstream: they inherit whatever access and approval decisions you make here.

What Counts as a Transformation?

  • If it changes what the reader sees, it is a transformation — and it needs to be written down.
  • Filters — kept only the core operational system-metro sites; excluded test and decommissioned entries; dropped records before go-live. Every exclusion is a choice.
  • Joins — merged partner status with site register on site_id. Joins can inflate, shrink, or silently drop rows.
  • Recodes — mapped eight site-power statuses into three buckets (green / degraded / off). Tell the reader which bucket theirs ended up in.
  • Derived fields — utilisation = active_channels / total_channels; service level derived from blocked-call rate. The formula is part of the number.
  • Manual fixes — overrode an obvious typo in a site name; re-tagged a backup-power unit logged to the wrong asset. Riskiest kind — log every one.
  • AI summaries are transformations too — log the prompt, the model, and what you kept or edited.

Evidence, Sources, and Versions

  • "I cleaned it up a bit" is not enough. A reviewer should be able to reproduce your number from the artefact alone.
  • Source: named system of record, when you pulled it, who owns it. "the delivery partner weekly status report, 14 Apr 2026 extract" — not "the usual export".
  • Version: which snapshot, what changed since last. Ship one version; never two files called "final".
  • Transformations: filters, joins, recodes, derived fields, manual fixes — in plain language a reviewer can follow.
  • Where it lives: change logs beside the output, data-dictionary tab, or notebook comments — the trail sits with the artefact, not in someone's inbox.
  • Same rule for AI-assisted work: the prompt is part of the source, the model and version are part of the transformation.
Worked Example: Transformation Log

Five fields, one row per change. Lives beside the artefact: a sheet, a report page, or a notebook comment.

FieldExample entry
Sourcethe delivery partner weekly status report, 14 Apr 2026 extract.
Versionv3, dated 15 Apr 2026. Supersedes v2.
ChangeFiltered to the core operational system metro subset; recoded eight power statuses into three buckets; cross-checked against the core operational system dashboard tile and the field status feed operational note.
OwnerNamed author of the extract, and named approver for publication at the stated marking.
Known limitsTwo sites under scheduled maintenance window excluded; one upstream feed stale since Tuesday; manual override flagged on one record.

If a teammate pastes this extract into an AI assistant, the same five lines need to travel with it.

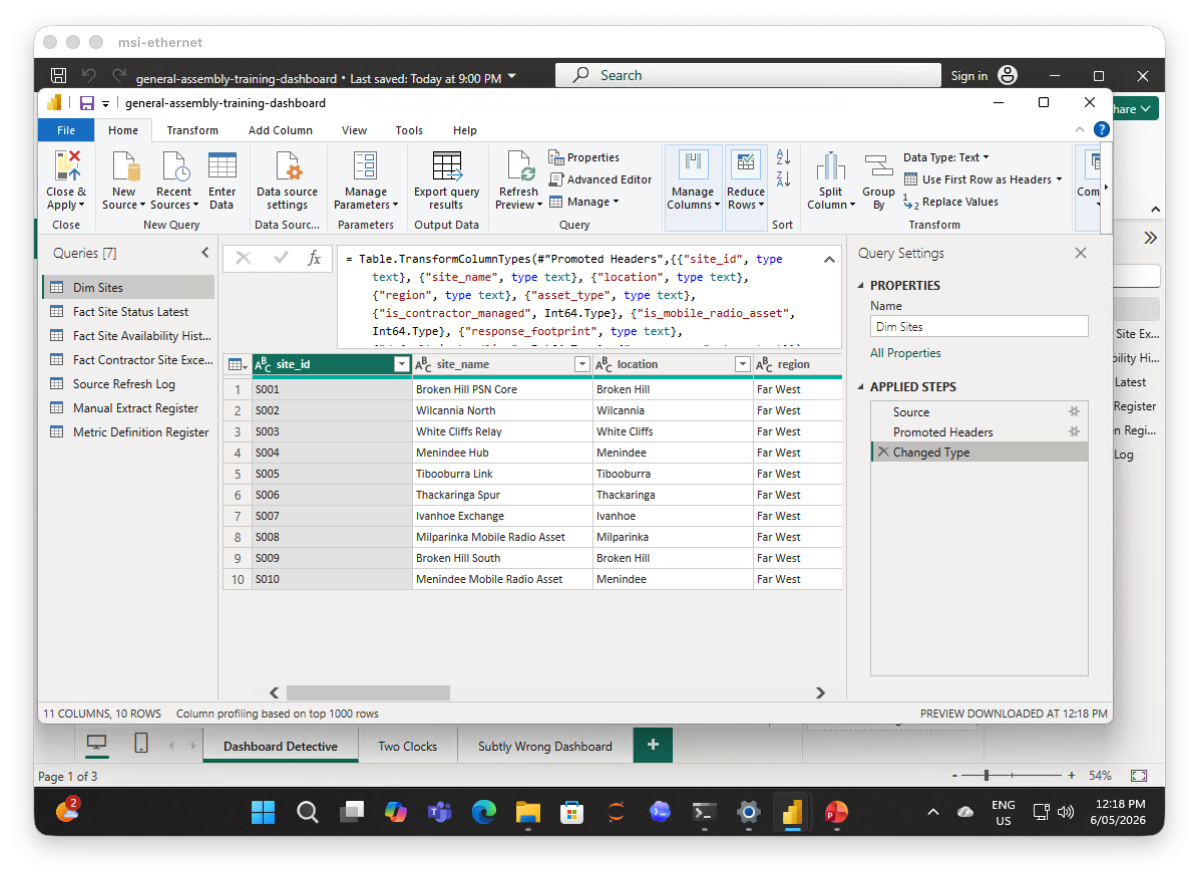
Power BI dashboards have repeatable transformations
Last updated: 2026

Data-driven decision making

The AI Context Trap

  • An AI assistant only sees what you paste, or what search turned up. Everything else is invisible.
  • Numbers travel; context doesn't — a metric pasted into a prompt loses its owner, source, refresh date, and caveats the moment it leaves the source system.
  • Definitions you didn't write down get invented — when "active customer" isn't pinned, the model fills the gap with a plausible-sounding default.
  • Stale snapshots feel current — AI won't flag that the figure is three months old; it answers as if you pasted today's number.
  • Confident summaries hide missing steps — fluent output doesn't tell you which transformation, filter, or override was skipped.

DATA QUALITY

  • Good Enough for What Decision? Quality is a threshold, not an absolute. The decision sets the bar.
  • Lower-risk: internal team retrospective
    • Approximate numbers are fine. 3-day-old data is fine. Directional signal is enough.
  • Higher-risk: the core operational system performance report to partner organisations or central agencies
    • Numbers must reconcile to the core operational system dashboard and status reports. Definitions auditable. Lineage traceable. No manual merges.
  • "Is it good enough?" only makes sense if you've said "good enough for what?"

DATA QUALITY

  • Worked Example: Three Different Quality Failures
  • Dashboard reads "the core operational system average service availability = 99.99%." The question on the table: are we operationally safe to proceed with planned maintenance during this weather event?
  • Freshness fails: the headline is rolled up from last week's status report. A site dropped onto backup power overnight — it isn't reflected yet.
  • Completeness fails: deployed deployable resources and deployable resources-supported sites aren't counted in the statewide average. The affected footprint looks healthier than it is.
  • Consistency fails: "availability" in the statewide rollup excludes planned service disruptions; the field status feed notes include them. Two teams reconcile to different numbers.
  • A statewide average can be valid for annual reporting and still be inadequate for an operational decision — affected-site availability, service level, utilisation, channel capacity, power status, deployable resources inclusion, and planned-service disruption embargoes all matter.

Same number. Three decisions. Is it good enough?

The number on the table: the core operational system average service availability = 99.99%, statewide, last refresh 6 days ago.

Team retrospective

Good enough? What would fail it?

Leadership update

Good enough? What caveat do you add?

Live incident decision

Good enough? If not, what do you need before calling it?

If an AI assistant gave you this number, the threshold question is the same: would you act on its answer for each decision, and what would have to be true to say yes?

Output one threshold per decision: "good enough because..." or "not yet because..."

Summary & Takeaways

What we covered today

  • Data, information and decisions are different.
  • Metrics need owned definitions, inclusions, exclusions, freshness and known limits.
  • Spreadsheets are useful, but they become risky when they behave like systems.
  • Data quality is always judged against a decision.
  • A vague request can be turned into a decision-ready brief.
  • Workplace action: choose one recurring spreadsheet, dashboard or request. Add the owner, source, as-at date, definition and caveat.
Transcript