Session 2 — Governance, Handling, and Publishable Outputs
Decision-Grade for Practitioners 2 — Governance & Publishable Outputs
Your Organisation × Industrial Linguistics
Session 2 of 3140-minute facilitated sessionLast updated: 2026-07-05
Session 2 Goals
Decision Briefs
Convert vague asks into decision-ready briefs, carrying forward the through-line from Session 1.
Classify
Identify dataset sensitivity and apply the right handling rules.
Document
Produce a publishable output that survives audit and stakeholder review.
Apply
Work confidently with sensitive data inside a regulated workflow.
Session 2 Roadmap
Five blocks. Each block ends with a hands-on activity so concepts land before we move on.
Decision-ready briefs
Governance and classification
Publishable outputs
Sensitive-data workflows
Request routing and automation
How to write a good spec
When you need to think about spec quality
Executives will pass requests to you
Sometimes they are ill-defined, and need some conversation (or intuition) to make a good specification
We’re also running Decision-Grade for Leaders
You will pass data requests to others
Be specific so the next person does not inherit your ambiguity.
What executives are learning in Decision-Grade for Leaders 1/2
Start with the decision, not the dashboard: define the decision, uncertainty, action threshold, time horizon, evidence needed, and handling constraints before asking for reports.
Challenge dashboards for trust cues: ask for source freshness as well as dashboard refresh, clear metric definitions, denominators, owners, caveats, and enough lineage to explain the result.
Reduce reporting risk: move away from versioned spreadsheets, screenshots, and copied extracts toward repeatable, source-connected reporting with clear ownership and traceability.
What executives are learning in Decision-Grade for Leaders 2/2
Sponsor practical data governance: reinforce need-to-know access, documented purpose, least privilege, share-by-link where appropriate, review/expiry, and auditability.
Apply responsible AI oversight: recognise AI beyond GenAI, distinguish approved from unapproved tools, and ask the core assurance question: “Has this been through the AI assurance process?”
Ask better vendor/tool questions: require disclosure of AI use, data handling, logging, retraining, change control, monitoring, and review arrangements before approval.
TLDR: what to ask, what not to accept, and what minimum standards to reinforce so teams can use data and AI with less hidden risk.
Four Steps of a Decision-to-Data Brief
1
Name the decision.
2
State timeframe, freshness, and required cut.
3
Say what action the output should enable.
4
Say how you'll judge whether the output is trustworthy enough to use.
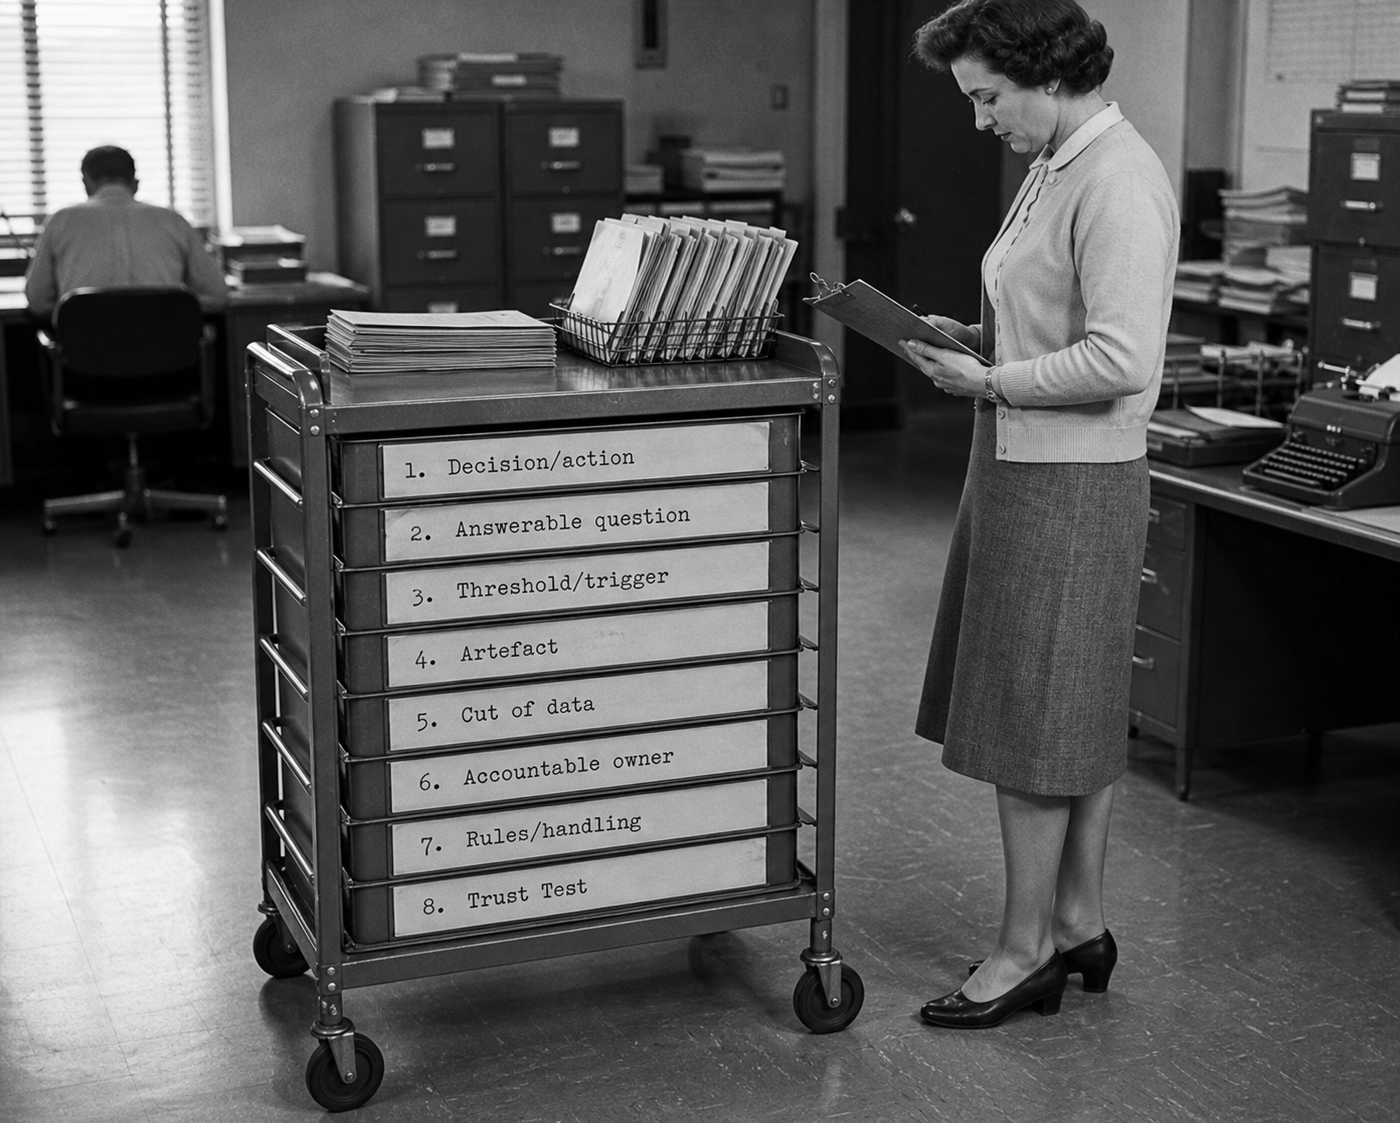
From Vague Request to DATA CART
A decision-ready request travels with the checks needed to answer it safely.
1. Decision/action
2. Answerable question
3. Threshold/trigger
4. Artefact
5. Cut of data
6. Accountable owner
7. Rules/handling
8. Trust Test
AI answers the question you actually asked
BRIDGE: DECISION-READY BRIEFS
Before: "Give me the latest the core operational system operational picture for the priority service area."
DATA CART field
After
Decision/action
Stage, deploy, or activate additional deployable resources for the core operational system continuity in the priority service area.
Answerable question
Which the core operational system sites or deployable resources require augmentation by location, power state, availability, capacity, and a partner organisation operational need?
Threshold/trigger
Act if two or more high-risk sites need current power, connectivity, or deployable resources support.
Artefact
One-page operational note with a dashboard reference, not a new dashboard.
Cut of data
Site A, Site B, Site C, Site D, Site E, Site F; latest the field status feed update; deployed vs activated status; site risk, a partner organisation requests, asset availability; relevant an external provider and confirmed field status inputs.
Accountable owner
Requester and operational owner to confirm the decision, approve the brief, and clarify gaps.
Rules/handling
Use the appropriate label, audience, approved channel, and sharing limits for operational status material.
Trust Test
Reconcile the core operational system dashboard, the field status feed notes, asset deployment log, and latest an external provider / confirmed field status updates; every asset labelled deployed, activated, staged, or not available.
Request Rewrite
Rewrite a vague request into a decision-ready brief.
Pick a real request you've received (or given) in the last month.
Write the brief, filling in the DATA CART fields.
Mark what's missing — which fields couldn't you answer without asking back?
Decide the right artefact — dashboard, one-off extract, written answer, or no data at all?
If you can't recall a real one, use the synthetic the priority service area the core operational system request from the worked example.
Output: a structured brief, not a brainstorm.
Optional tool: try the DATA CART web helper at https://decision-grade.industrial-linguistics.com/data-cart. Use synthetic or fictional examples only — it is an external, unsigned demonstration site, so do not enter real personal, sensitive, or client information.
Decision-Ready Briefs
Swap briefs. One writes, one marks what is missing.
Swap briefs with a partner. You mark theirs; they mark yours.
Read as the analyst receiving this request. Could you act on it without asking back?
Mark what is missing — decision, audience, timeframe, metric definition, quality bar, expected artefact.
Hand back one rewrite — the single change that would most improve their brief.
Output: a marked-up brief and one concrete improvement.
Brief Peer Review
Decision-Ready Briefs
COURSE THROUGH-LINE
Course Challenge: Fix One Artefact
Take one real artefact back to work. Give it a passport.
Pick one dashboard, spreadsheet, report, or extract you publish or rely on. Add the six fields, even if only in a comment or cover note:
OwnerSourceVersionFreshnessHandlingKnown limits
Run this in the next two weeks. Bring the fixed artefact back to your team, and to Session 3 as the handling-rules check.
Because you are brilliant, others will learn from your wisdom (in response to that good spec)
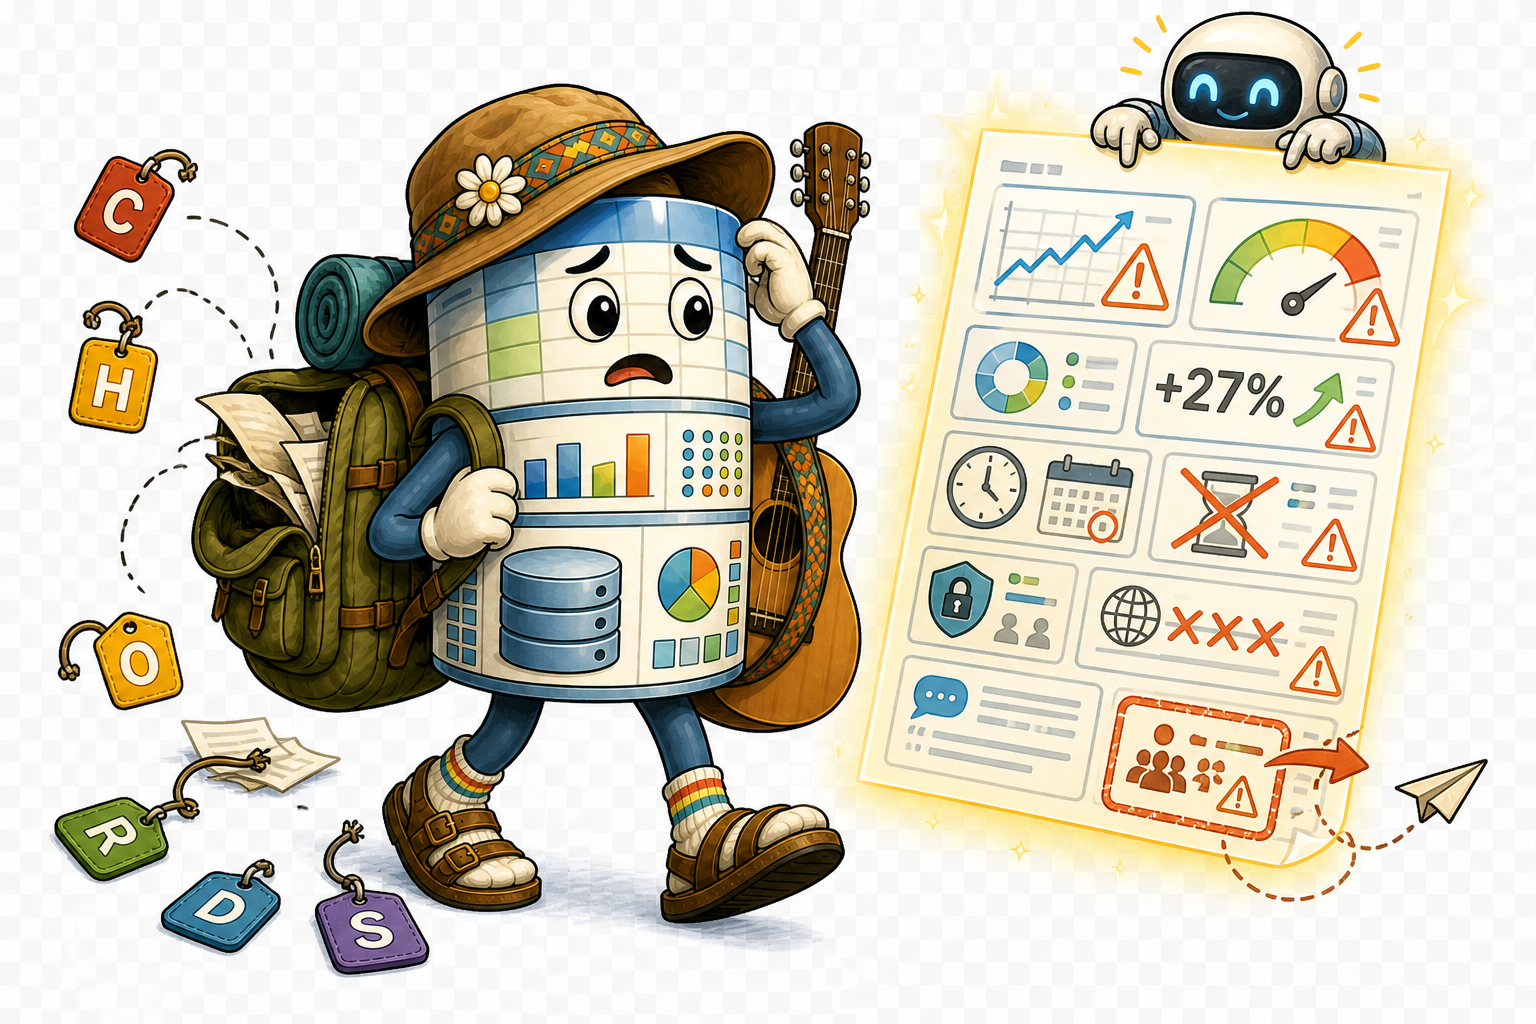
If CHORDS Isn't in Place, AI Makes These Kinds of Mistakes
Missing CHORDS shows up as:
Caveat missing — the model states a number with confidence the data doesn’t support.
Handling missing — sensitive material gets quoted in an output that travels further than it should.
Owner missing — nobody to ask when the answer looks wrong, so the wrong answer ships.
Refresh missing — stale figures are presented as the current state of the network.
Definition missing — two metrics that sound alike get mixed, and the recommendation tilts the wrong way.
Source missing — the model fills the gap with a plausible-sounding but fabricated reference.
For dashboards, use CHORDS and dashboard clocks
A Power BI dashboard is a maintained product. It needs named owner, version, refresh policy, metric definitions, known limits, support path, review point, retirement trigger.
Two clocks (three with AI).
Forwarded spreadsheet: one clock — the as-at date.
Power BI dashboard: two — when the tile refreshed, and when the upstream source actually changed.
With AI layered on top: a third — when the tool last retrieved or indexed the context.
What to respond with (to that good spec)
BRIDGE: WHAT AI ACTUALLY CHANGES
Effort no longer decides the artefact. Dashboards used to be the hardest artefact to produce, report writing the easiest. AI compresses all four to roughly the same effort.
Artefact
Before AI
With AI
Dashboards
Max
Low
Spreadsheets
High
Low
Extracts
Medium
Low
Report writing
Low
Low
The trap isn't that AI lowers quality — it's that we now reach for the most ambitious artefact by default. Ask what form best fits the decision, not which one looks most impressive to make.
BRIDGE: DECISION-READY BRIEFS
Match the Artefact to the Decision
If you can't say which of these four you are producing, you are not ready to build the artefact.
Dashboards monitor. Standing view of a changing state for an operational user.
Briefs decide. A written recommendation a leader can act on.
Spreadsheets reconcile. A bounded list someone needs to sort, filter, or check.
Clarifications unblock. Ask back before building anything when the request is not yet answerable.
BRIDGE: DECISION-READY BRIEFS
When a Dashboard Is the Right Answer. Build the tile when the recipient needs a standing view of a changing state.
The state actually changes between glances. the core operational system site status, power state, capacity, utilisation, service level during an evolving incident.
An operational user will return to it repeatedly. Same user, same handful of metrics, multiple times a shift — not a one-off lookup.
The metrics are stable and well-defined. CHORDS holds: source, owner, refresh cadence, definition, caveats, handling are all settled.
Reading the tile leads directly to an operational action. Dispatch a deployable resources, reroute connectivity, escalate — not "interesting, we should look into that".
BRIDGE: DECISION-READY BRIEFS
When a Dashboard Is the Wrong Answer. If the question matches one of these, send something else — not a link to something in Power BI.
A leader needs a recommendation. Write a brief — e.g. whether to stage another deployable resources at a priority site, or embargo planned maintenance.
Someone needs to reconcile rows, not monitor a trend. Send a spreadsheet — bounded list of the core operational system sites and deployable resources with deployed/activated status, power source, availability, last confirmed update.
The metrics aren't settled. Definitions still in flux, owner unclear, refresh ad hoc. Settle CHORDS first; a dashboard locks in the wrong number at scale.
The question isn't answerable yet. Ask back before building anything — scope, audience, and decision aren't clear.
It's a one-time look. Nobody will return to it. Answer in a message or a screenshot; don't add to the dashboard estate.
BRIDGE: DECISION-READY BRIEFS
When a Spreadsheet Is the Right Answer. Hand over rows when the recipient needs to reconcile, not monitor.
The output is a list, not a trend. A reconciliation of the core operational system sites with deployed/activated status, power source, availability, last confirmed update — rows someone will work through.
The recipient needs to sort, filter, annotate, or join. e.g. cross-checking deployable resources against a maintenance window, or ticking off sites as they are confirmed.
The scope is bounded and used once (or a few times). Defined sites, defined as-at timestamp, defined fields. CHORDS travels with the file.
An audit or handover needs the underlying rows, not a summary view. Someone else has to be able to verify the numbers behind a recommendation.
Dashboards and spreadsheets
Pick a dashboard (e.g. from PowerBI) that you find helpful, or that you use regularly.
Why is it a dashboard? What is the thing that it is monitoring? How does it get refreshed? Why does it help to have that as a dashboard?
Pick a spreadsheet that you found helpful
What was it reconciling? Why was a spreadsheet the best way to deal with this?
If you have no examples of good dashboards or spreadsheets, feel free to invert this exercise to talk about the worst and most unhelpful (and explain why)
The “H” in CHORDS - handling
Data Classification and Handling
Retention & Review
Keep it as long as you need it; review on a cadence. Deletion is a feature, not a failure.
Purpose
Use data only for the purpose it was collected for. Reuse for a new question means ask, not assume.
Classification
Sensitivity level is a signal for handling: official, sensitive, or protected changes how it moves, is stored, and is shared.
Access
Least privilege by default: the right people see the right slice, no more, and need-to-know is auditable.
Local Handling Language: Official, Sensitive, Protected
Example labels: Official, Sensitive and Protected, or your organisation’s local equivalents.
Always use the exact your organisation label shown in the managed environment, and confirm unclear cases with the information owner.
Official — routine business. Share on need, inside approved environments. Default care, not extra friction.
Sensitive — formally Sensitive with a handling marker or handling limit. Tighter access, named audience, no external sharing without approval.
Protected — higher bar again. Named access list, documented purpose, and a reason it cannot be done at a lower marking. Handled in the approved environment only.
When unsure — hold at the higher marking and ask the information owner. Downgrading is cheap; recalling a share is not.
Detailed the shared document repository / DLP label-picker training sits in the your organisation reference material, not in this session — today's focus is the judgement call.
Minimum Safe Sharing Rules
TRAVEL is the quick check before information leaves your hands. Keep the data inside approved environments — no personal drives, personal accounts, or unmanaged tools.
T — Tag / label the exact your organisation handling marking on the artefact itself.
R — Reason the decision or question this will serve, in one line.
A — Audience named recipients or a scoped group, not "the team".
V — Venue / channel an approved environment appropriate to the marking; share the link, not the file.
E — Evidence / as-at named source system and the date the data represents, on the artefact.
L — Limit / expiry when the recipient deletes, refreshes, or re-confirms access.
Pasting into a chat, uploading to a tool, or pointing an agent at a folder is a sharing act. TRAVEL still applies — but four letters change shape.
A — Audience the model is a recipient. Assume the vendor, the training pipeline (if there is one), and anyone who later prompts it (if there is memory) are part of the audience.
V — Venue use only your organisation-approved AI tools and tenancies. Public Copilot, ChatGPT.com, free Gemini = not an approved venue for work content. Random sites from training vendors are a liability
E — Evidence AI outputs aren't sources. Treat them as drafts; trace any number, name, or quote back to the system it came from before it leaves your hands.
L — Limit the model has no expiry. If there is memory, then what you paste in today can resurface in another chat, another team, another tenancy. Don't paste what you wouldn't email.
AI access is still access.
TRAVEL + AI
Records, Retention, Disposal, and Evidence Trail
Not every file is a record. Know which is which before you delete, archive, or forward.
Working file — drafts, scratch extracts, a pivot you rebuilt three times. Useful to you, not proof of anything. Dispose when done.
Record — the version you actually sent, published, or made a decision on. Kept for the retention period, in an approved location.
Evidence trail — the chain behind the record: source pull, transform notes, approver, date. Lets someone reconstruct the number months later.
Three practical questions — what do we keep, what do we dispose of, and what do we archive or refresh. Answer before you close the tab.
AI Doesn't Change Recordkeeping
For NSW Government agencies, the State Records Act 1998 (NSW) still applies. AI tools add three places where records hide.
Prompts and pasted content are records. Anything you type that documents a decision, advice, or transaction is a State record the moment you send it — same as an email.
The output is the easy half. People keep the report. They don't keep the prompt, the attachments, or which model produced it — exactly what an auditor or FOI request will ask for.
Disposal cuts the other way. A model with retrieval over SharePoint sees what's there today. Records that should have been disposed of get resurfaced — retention failures become live again.
Tool tenancy is not a records system. Copilot or ChatGPT conversations get auto-purged or kept indefinitely on vendor defaults — neither matches NSW Government retention and disposal authorities.
If it's a record on paper, it's a record in the prompt.
Another one of those strange AI-powered web apps: “AI Data Checkpoint”
Name what travels — before work data enters an AI tool, decide what is really moving: the prompt, the upload, the retrieved folder, the generated output, the memory, or the record.
Choose the safest route — in pairs: Allow, Minimise first, Use a synthetic example, Ask the owner, or No AI for this.
Risk & control — name the risk you caught and the control that must travel with the output. AI access is still access; the label follows the content.
Access Request Tribunal
Table groups. Three inbound access requests. For each one: approve, reject, or ask back.
Requests (synthetic) — (a) "Send me the full the core operational system operational picture so I can brief my director tomorrow." (b) "Can I get site power status for every site for a vendor capability assessment — ongoing access?" (c) "I need last month's channel capacity and service level figures for three regions, for a specific after-action review."
Decide and defend — for each request, which lane and which missing element closes it.
Each snippet looks fine on its own. Combine three of them and ask: what marking would this composite picture attract — and why?
Snippets (synthetic) — a public map of a regional town; a list of generic site IDs with utilisation bands; a deployable resources staging location with no dates; a roster of backup-power units by model number; an a partner organisation liaison roster with first names.
Combine — which three, when joined, reveal the service area for a specific incident?
Action — pick the combined marking, then name which owner you would confirm with before publishing the composite.
What dashboards need beyond CHORDS
Dashboard as a Data Product
If you publish it, you maintain it. Every dashboard is a small product.
Owner
A named human accountable for what it says. Not a mailbox, not a team alias.
Version
Visible on the artefact. A logic change bumps the version and gets a one-line note.
Refresh policy
Both clocks: when the tile last redrew, and when the upstream feed last wrote.
Known limits
Exclusions, definition gaps, and the reads it cannot support.
Support path
Where a reader goes when it breaks or when a number looks wrong.
Review / retirement
When it is reviewed next, and the trigger that retires it.
Dashboard Publication Checklist
Owner & Definitions
Named owner on the artefact. Each metric has one agreed meaning shown alongside.
Source & Freshness
Source named; as-at date visible. Make dashboard vs source refresh explicit.
Limitations
Known gaps, exclusions, and reporting changes are called out, not hidden.
Audience & Access
Right audience, right level of detail. Local-file copies fail this test.
TRACE the number before you trust the number: Track source, Record version, Account for transformations, Caveat limits, Evidence trail.
Two Clocks: Dashboard Refresh vs Source Refresh
"Last refreshed 2 minutes ago" tells you the tile is fresh. It does not tell you the number is.
Clock 1: dashboard refresh
When the tile last queried its source. In the example: 08:03 today.
Clock 2: source refresh
When the upstream system last wrote new data. In the example: stale since Tuesday. Invisible unless you check.
Show both clocks on the artefact, or show the older of the two. If a feed is stale past its tolerance, mark the tile as not current and say what is excluded. AI adds a third clock: context freshness.
Plain but Publishable vs Polished but Unsafe
Same monthly service disruption number, two versions. Polish is not trust.
Plain but publishable — a black-and-white table. Title says "Priority 1 incidents, metro region, Mar 2026". Named owner. Source and as-at date on the page. One footnote noting two sites were under maintenance. It looks dull. You can defend every number.
Polished but unsafe — a full-colour dashboard with map overlays, trendlines, and a glossy header. No owner. No source. "Last updated" shows today, but the underlying extract is a local copy from three weeks ago. Regions are inconsistent — some use postcode, some use LGA.
What changes the answer — the polished one would pass a glance test in any exec meeting. It would also mislead the meeting. The plain one wouldn't win a design award, and it's the one you send.
The rule — trust is provenance, ownership, and caveats visible on the artefact. Everything else is decoration.
Dashboard Detective: GA Training Dashboard
Open the Power BI training dashboard (synthetic data, GA-hosted). Spend ten minutes finding what a publisher should have caught.
Spot it — missing source-refresh cues; unclear or missing definitions; a percentage with no denominator; copied-extract or local-file lineage; audience or handling marker that does not match the environment.
Note it — for each issue, write one line: what you saw, why it matters, and what you would change before it could be published.
Debrief — share the worst issue you found and the one most likely to fool a busy reader. We line them up against the Dashboard-as-a-Data-Product fields.
Power BI synthetic training dashboard — link in the chat.
Working across parallel environments
If you run parallel environments
Some organisations run two separated environments — for example a secure network and a corporate network. If that is you, these rules apply:
Access — the two environments are governed separately. Use the access you have been granted in each; do not assume a permission in one carries to the other.
Copied extracts — do not move, copy, export, screenshot, or summarise across environments unless authorised. A copy made for convenience is the most common way data ends up where it should not be.
Publication & sharing — publish only into approved environments, follow the confirmed local process for the destination, and use the handling marker the receiving environment requires.
Honest truth — All organisations that run dual (or more) security environments face challenges. Not every problem can be solved well.
Controlled extracts: secure side to corporate side
Corporate need
the core operational system-side source data
What should move to the shared document repository Corporate
Budgeting & cost recovery
the core operational system cost centres, project codes, vendor spend, charge-back models
Aggregated cost-recovery feeds; budget actuals by program
Asset class summaries and forward refresh schedules
Legal & FOI
Disclosure logs, FOI request history, redaction precedents
Disclosure case summaries and standard redaction rules
Corporate often needs a controlled extract, not the operational record itself.
Mosaic risk
Combination in the shared document repository Corporate
What it may reveal
Why that becomes sensitive
Procurement spend + project codes
Which programs are under-resourced or being wound down
Pre-public funding decisions, signals for affected communities or competitors
Audit findings + remediation status
Which controls are weak today and for how long
Roadmap for exploitation by an insider or external actor
Open FOI cases + disclosure logs
What topics journalists and applicants are probing
Pattern of public-interest pressure; tip-off about pending releases
Asset register + lifecycle stage
Which systems are end-of-life or unsupported
Targeting for cyber-attack on aging or unpatched infrastructure
Staff records + project assignments
Who works on what and when
Inference of identities for sensitive programs (e.g. critical infrastructure, critical infrastructure sites)
Calendar + procurement + travel data
Pre-announcement movements of executives or ministers
Signals about deals, investigations or political activity not yet public
And the problem is…
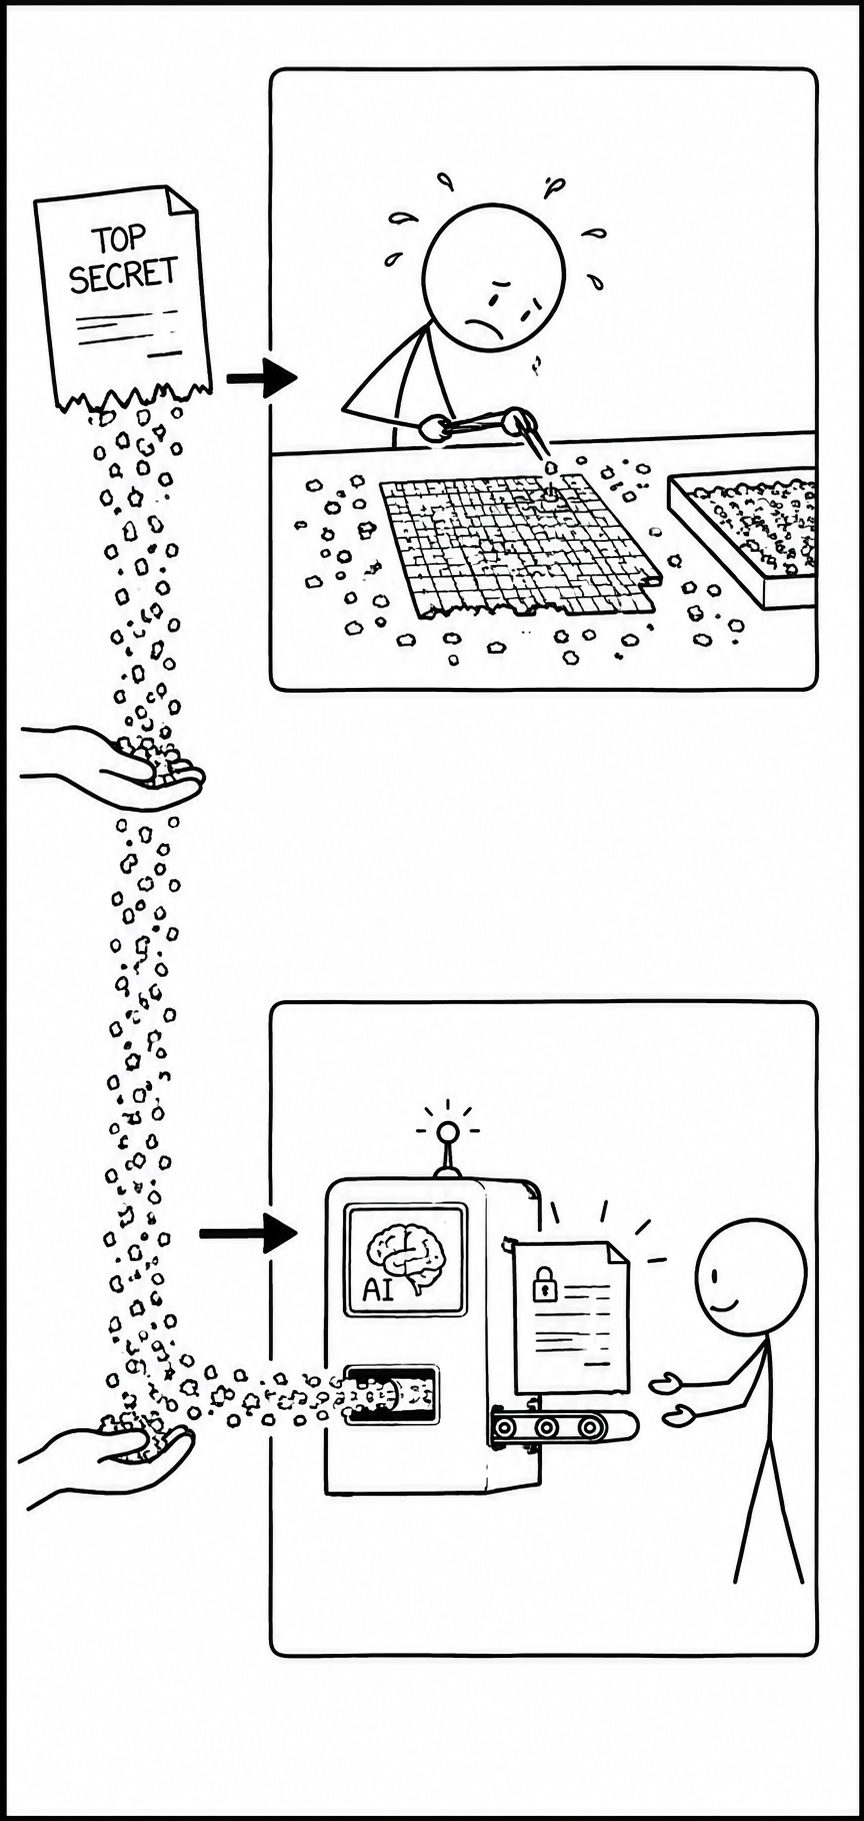
Aggregating lots of minor data points into a complete whole is so tedious that no-one would ever do it.
In a world of humans doing information aggregation, the snippets of secure data that made it into the shared document repository didn’t pose a security problem.
If you did deliberately aggregate snippets, you knew you were breaking the rules
But in a world with AI doing information aggregation, you can accidentally create a classified document in the shared document repository.
Usual protocols apply for dealing with misclassified data
Mosaic risk dataset
Download the Mosaic Risk zip file from https://decision-grade.industrial-linguistics.com/downloads/data-minimisation-extract-challenge.zip
There is a spreadsheet of fake data that could be from the core operational system Secure network.
Executives want to know which regions experienced service disruptions in Q1 2026, what the main causes were, and how long service disruptions lasted on average. They do not need to know which specific sites or engineers were involved.
Select a minimal set of fields to share and decide how to aggregate the data to meet the business need. For example, you might summarise: total number of incidents per region, average duration per region, counts of incidents by cause (weather, equipment failure, etc.).
What information does that cause to leak? What potentially secure information is being made public?
What we covered today
A good data request starts with a decision, not the artefact.
Classification is a handling decision, not a label decoration.
A publishable output needs source, owner, as-at date, definition, caveat, handling and review context.
Dashboards are data products and need trust cues.
AI outputs inherit the governance of the data, prompts and tools used to create them.
Workplace action: take one output your team forwards regularly. Add the context that must travel with it.